Keywords: resistance zone, support zone, close price, original array, green zone, green candle, group, epsilon, list, programming, computer, logic. Powered by TextRank.
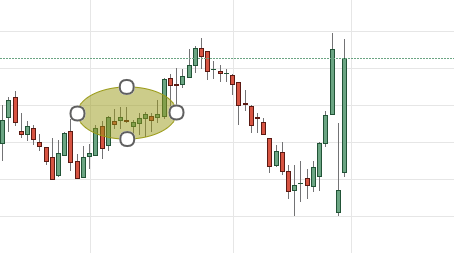
support/resistance zones are quite essential when trading breakouts. Support is a line below the price on the charts that the price bounced back from a couple of times. Resistance is the same, but above the price. When a human looks at a chart, it’s pretty easy for them to see these points on the chart:
the shaded are is a support/resistance zone, as the price tries multiple times to go past that point and succeeds with that long green candle. How to get the computer to recognize these points it an interesting exercise in programming. The logic is this:
in the end you will have a list of lists. The more items in the list, the stronger the support/resistance around that area.
The worst case running time for the above algorithm is n^2 if all the prices are more than epsilon away from each other, which is not very good. So we need to improve on that.
We can build the groups as we are iterating the original array like this:
of the group we add it to that group. Otherwise we create a new group and add it into that group.
Collections.sort(data);
        SuperList<SuperList<Double>> groups = new SuperList<>();
        groups.add(new SuperList<>());
        groups.get(0).add(data.get(0));
        for (int i = 1; i < data.size(); i++) {
            SuperList<Double> group = groups.getLast();
            Double x = data.get(i);
            if (Math.abs(x - group.get(0)) < epsilon) {
                group.add(x);
            } else {
                SuperList<Double> newList = new SuperList<>();
                newList.add(x);
                groups.add(newList);
            }
        }
I finally had the chance to plot the results of this, so I updated the post:
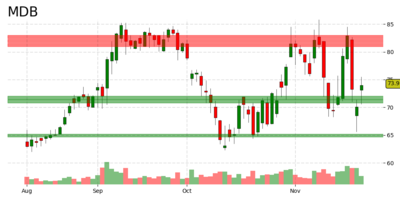
The red zones are the resistance which is all tuples with price above the last close price and the green zones are the support zones.
387 words
Powered by TF-IDF/Cosine similarity
First published on 2019-07-23
Generated on 11 Aug 2025 at 12:23 PM
Mobile optimized version. Desktop version.