Keywords: day stock, day trading, stock price, trading day, daily stock, daily resolution, low, high, list, good, noise, line, interpolation, upsampling, element. Powered by TextRank.
Finding good data for stock prices is a pain. There are some paid providers which are good as far as their reviews go but are pretty expensive. I've been using the free Yahoo data api that gives stock prices on a daily resolution. Is this probably fine for most algorithms but I wanted to come up with a method for increasing the resolution of the data from daily to minutely for day trading applications.
Some research on this showed that this process is called "upsampling" which is the reverse (doh!) of downsampling. Downsampling is easy, you just lose some of the data to reduce the bandwidth, but the reverse is not easy. I didn’t really see any useful articles for financial data (there are some for other types of time series). The major difference for daily stock data is that you have some extra data points such as the high and low of the day, the open and close. All this can be incorporated into the upsampling process to make it more realistic.
The main idea for upsampling is interpolating the missing data points in between the given data points. There are a couple of ways this can be done:
….
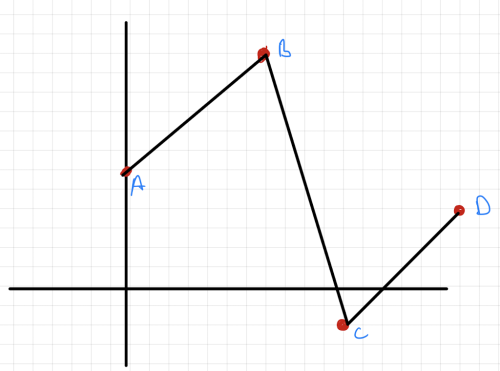
In the image you only have the data points A,B,C,D and these points are joined by lines. Since you can figure out the equation of a line given two points you interpolate that the missing data points are on that line. This is called “linear interpolation” because you are drawing lines. A line is an equation of the first degree. If you take this to higher degrees you will get a smoother fit, this is called polynomial interpolation.
For interpolating stock price data we use the open price and close price at the beginning and end of a list. We can then fill that list up with N null values, N depending on the resolution we are aiming for. If we wanted minutely resolution then we would select N as follows: The market opens at 9:30a and closes at 4p (discard extended hours). This means there are 6.5 hours worth of minutes which are 6.5 * 60 = 390 minutes. So we would have an array with 390 elements for each trading minute. The first element of this array would be the opening price and the last would be the closing price.
During the day the stock makes a high and a low. We can select these points to be random points in the day. There are no obvious patterns of when during the day stocks make their high and low points so a uniform random selection is adequate. One invariant is that the time of the high and low cannot be the same. Once we have the indices for the high and low points in the day we can put those values in the array at the correct points. Our list would be something like this
[open, ….., high, …., low, …. Close]
Now we can run a linear or polynomial interpolation of a low degree to get the missing data points. The resulting chart wouldn’t be a good representation of the path a stock price would take during a trading day. The missing element here is noise. To add noise we can adjust each point on the lines by a random factor from a gaussian distribution. The reason to use a gaussian distribution is that most of the price movements from point i to point i+1 are within a certain percentage.
A function like
fn = lambda x: random.gauss(x, x/50)
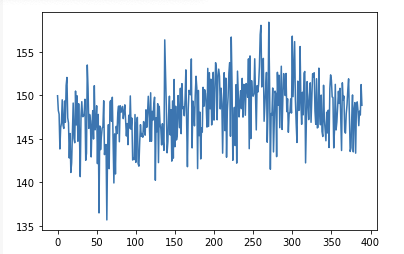
That is applied on each element of the list will introduce a good amount of noise. Plotting this graph will show that we have a very jagged chart with sharp movements.
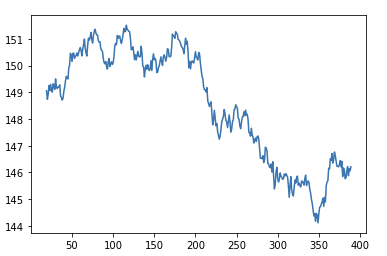
We can smooth this signal by taking a rolling average of N periods to achieve a final chart that looks this
656 words
Powered by TF-IDF/Cosine similarity
First published on 2021-10-15
Generated on 11 Aug 2025 at 12:23 PM
Mobile optimized version. Desktop version.