 ]
]Keywords: time series pattern, pattern match, stock, approach, signal, idea, distance, history, shape, sum, absolute, difference, good. Powered by TextRank.
Playing around with stock data is always fun. I think using any of the methods you see around here are a good way to lose money so only use for your self education or entertainment.
So the basic idea around this a pattern matching approach is that history will repeat itself. That means for the stock we want to predict at time T, let's get all the data points from T-x and try to match the pattern that this produces against the history of other stock and then for all the matches at a point in time, say T' (which is before T) we can look at T'+1, T'+2, ... to see what that stock did. Is this a good way to trade? Probably not, but it's a fun little project for learning about vector similarities.
So how do we know that a time series pattern is looks like another one? The idea is to match the shape of the series so we need to disregard the amplitude of the signal. E.g the following signals have the shape but are quite far away from each other
s1: [1,2,3,4,5]
s2: [1001, 1002, 1003, 1004, 1005]
The approach I'll describe here is a simple approach called manhattan distance similarity. The idea is to scale down the two signals so that their values are between 0 and 1. This way both signals become comparable for our distance metric. The distance is the sum of the absolute value of the difference of each element with the same index.
So for a signal [0.5, 0.7, 0.9] and [0.4, 0.6, 0.8] the difference is [0.1, 0.1, 0.1] and the sum is 0.3. Taking the absolute value negates the fact that the signal could be above or below the other.
This is a brute force approach and there are faster data structures for these types of queries such as KDTrees that are efficient if the signal length is short (maybe < 20 periods)
There are other methods of time series comparison suck dynamic time warping that are resistant to phase shift etc and could be used to optimize the search.
To start let's load all our stock data into a dictionary of dataframes.
import os
import pandas as pd
directory = "../../exo/Workbench/csv/"
dfs = {}
for filename in os.listdir(directory):
    dfs[filename.replace(".csv", "")] = pd.read_csv(os.path.join(directory, filename), index_col="date")
dfs["aapl"].head()
           symbol      open      high       low     close       volume
date
1980-12-12   aapl  0.128348  0.128906  0.128348  0.128348  469033600.0
1980-12-15   aapl  0.122210  0.122210  0.121652  0.121652  175884800.0
1980-12-16   aapl  0.113281  0.113281  0.112723  0.112723  105728000.0
1980-12-17   aapl  0.115513  0.116071  0.115513  0.115513   86441600.0
1980-12-18   aapl  0.118862  0.119420  0.118862  0.118862   73449600.0
Let's define some constants to make the code reusable with different parameters
WINDOW = 20
MAX_CANDIDATES = 5
TARGET_ENDDATE = "2021-07-14"
TARGET_STARTDATE = "2020-01-14"
TARGET_SYMBOL = "AAPL"
A class to hold the results of the matching
class SimResult:
    def __init__(self, symbol, score, start, end, past, future):
        self.symbol = symbol
        self.score = score
        self.start = start
        self.end = end
        self.past = past
        self.future = future
    def __repr__(self):
        return f"{self.symbol} {self.score} {self.start} {self.end}"
import time
from sklearn.preprocessing import MinMaxScaler
start = time.time()
target_enddate = TARGET_ENDDATE
target_startdate = TARGET_STARTDATE
target_symbol = TARGET_SYMBOL.lower()
import numpy as np
src_df = dfs[target_symbol].loc[target_startdate:target_enddate].copy()
src_df['scaled_close'] = MinMaxScaler().fit_transform(src_df.close.values.reshape(-1, 1))
src_window = src_df[-WINDOW:].scaled_close
progress = 0
simres = []
mod = len(dfs) // 10
for symbol, df in dfs.items():
if symbol == target_symbol:
continue
if progress % mod == 0:
print(".", end='')
progress += 1
tgt_df = dfs[symbol].loc[target_startdate:target_enddate].copy()
if len(tgt_df.close) < WINDOW + 1:
continue
if df.iloc[-1].close < 10:
continue
tgt_df['scaled_close'] = MinMaxScaler().fit_transform(tgt_df.close.values.reshape(-1, 1))
scores = tgt_df.scaled_close.rolling(window=WINDOW).apply(
lambda x: -sum([abs(x-y) for (x,y) in np.stack((x, src_window), axis=1)])
)
index = scores.argmax()
sr = SimResult(symbol, scores.max(), "", "",
tgt_df.iloc[index-WINDOW:index].scaled_close,
tgt_df.iloc[index:index+WINDOW].scaled_close)
simres.append(sr)
simres.sort(key=lambda x: x.score, reverse=True)
print("elapsed", time.time() - start)...........elapsed 69.85303258895874
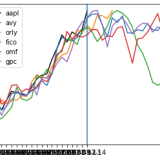
import matplotlib.pyplot as plt
import numpy as np
y = src_window
plt.plot(y, label=target_symbol, color='black')
for i in range(0,5):
    both = np.concatenate([simres[i].past , simres[i].future])
    plt.plot(both, label=simres[i].symbol)
plt.axvline(x=WINDOW-1)
plt.legend()
plt.show()
]
621 words
Powered by TF-IDF/Cosine similarity
First published on 2021-07-22
Generated on 11 Aug 2025 at 12:23 PM
Mobile optimized version. Desktop version.